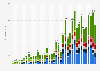
This statistic shows the number of Internet of Things (IoT) units installed in Asia/Pacific from 2013 to 2020. In 2014, 3.62 billion IoT units were in use in the Asia Pacific region.
Installed base of the Internet of Things in Asia/Pacific from 2013 to 2020 (in billion units)
Basic Account
Get to know the platform
You only have access to basic statistics.
This statistic is not included in your account.
Starter Account
The ideal entry-level account for individual users
- Instant access to 1m statistics
- Download in XLS, PDF & PNG format
- Detailed references
$199 USD / Month *
Professional Account
Full access
Business Solutions including all features.
* Prices do not include sales tax.
Other statistics that may interest you Internet of Things (IoT)
Overview
6
- Basic Statistic IoT global annual revenue 2020-2030
- Premium Statistic Internet of Things (IoT) spending worldwide 2023
- Premium Statistic Revenue in the internet of things market Worldwide 2018-2028
- Premium Statistic Revenue change in the IoT market worldwide 2019-2028
- Basic Statistic Number of IoT connected devices worldwide 2019-2030, by vertical
- Premium Statistic Global revenue share of IoT solutions 2023, by layer
Segments
5
- Premium Statistic Industrial IoT - market size worldwide 2020-2030
- Premium Statistic Smart city revenue worldwide 2020-2028
- Premium Statistic IoT sensors market revenues worldwide 2018-2025
- Premium Statistic Revenue from the Automotive IoT segment worldwide 2018-2028
- Premium Statistic Application of IoT in agriculture by segment 2020-2026
Consumption
5
- Premium Statistic Investment in IoT (Internet of Things) 2018-2022
- Premium Statistic Global shipment forecast for smart home devices 2018-2027, by category
- Premium Statistic Quarterly wearables shipments worldwide 2014-2023, by vendor
- Premium Statistic IoT connections globally 2020-2030, by application
- Premium Statistic Wide-area and short-range IoT device installed base worldwide 2014-2027
Cellular IoT
4
Smart home
4
- Premium Statistic Number of users of smart homes worldwide 2019-2028
- Premium Statistic Penetration rate of smart homes worldwide 2019-2028
- Premium Statistic Revenue of the smart home industry worldwide 2019-2028
- Premium Statistic Number of users of the smart home segment security worldwide 2019-2028
Further related statistics
1
Further Content: You might find this interesting as well
IDC. (October 30, 2015). Installed base of the Internet of Things in Asia/Pacific from 2013 to 2020 (in billion units) [Graph]. In Statista. Retrieved June 10, 2024, from https://internal.statista.com/statistics/510780/iot-installed-base-asia-pacific/
IDC. "Installed base of the Internet of Things in Asia/Pacific from 2013 to 2020 (in billion units)." Chart. October 30, 2015. Statista. Accessed June 10, 2024. https://internal.statista.com/statistics/510780/iot-installed-base-asia-pacific/
IDC. (2015). Installed base of the Internet of Things in Asia/Pacific from 2013 to 2020 (in billion units). Statista. Statista Inc.. Accessed: June 10, 2024. https://internal.statista.com/statistics/510780/iot-installed-base-asia-pacific/
IDC. "Installed Base of The Internet of Things in Asia/Pacific from 2013 to 2020 (in Billion Units)." Statista, Statista Inc., 30 Oct 2015, https://internal.statista.com/statistics/510780/iot-installed-base-asia-pacific/
IDC, Installed base of the Internet of Things in Asia/Pacific from 2013 to 2020 (in billion units) Statista, https://internal.statista.com/statistics/510780/iot-installed-base-asia-pacific/ (last visited June 10, 2024)
Installed base of the Internet of Things in Asia/Pacific from 2013 to 2020 (in billion units) [Graph], IDC, October 30, 2015. [Online]. Available: https://internal.statista.com/statistics/510780/iot-installed-base-asia-pacific/