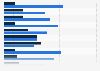
This statistic shows the percentage of population without access to improved water sources worldwide from 1990 to 2015. In 2010, some 11.6 percent of the world's population had no access to improved water.
Percentage of population without access to improved water sources worldwide from 1990 to 2015
Basic Account
Get to know the platform
You only have access to basic statistics.
This statistic is not included in your account.
Starter Account
The ideal entry-level account for individual users
- Instant access to 1m statistics
- Download in XLS, PDF & PNG format
- Detailed references
$199 USD / Month *
Professional Account
Full access
Business Solutions including all features.
* Prices do not include sales tax.
Other statistics that may interest you Global demographics
Overview
7
- Basic Statistic Total population worldwide 2022
- Basic Statistic Distribution of the global population by continent 2023
- Basic Statistic Countries with the largest population 2024
- Basic Statistic Countries with the highest birth rate 2023
- Premium Statistic World: annual birth rate, death rate, and rate of natural population change 1950-2100
- Basic Statistic Degree of urbanization 2023, by continent
- Basic Statistic Projected global life expectancy 1990-2100
Population
7
- Basic Statistic World population - forecast about the development 2022-2100
- Basic Statistic Forecast: world population, by continent 2100
- Basic Statistic Global population 2000-2022, by gender
- Basic Statistic World population by age and region 2023
- Premium Statistic Number of centenarians worldwide by gender 2000-2100
- Basic Statistic Countries with the highest population growth rate 2023
- Basic Statistic Countries with the highest population decline rate 2023
Life expectancy
7
- Premium Statistic Life expectancy at birth worldwide by region 2019
- Premium Statistic Average life expectancy at birth worldwide by gender 2019
- Premium Statistic Countries with the highest life expectancy 2023, by gender
- Premium Statistic Countries with the highest life expectancy 2021
- Premium Statistic Countries with the lowest life expectancy 2021
- Premium Statistic Countries with the lowest life expectancy worldwide 2023, by gender
- Basic Statistic Countries with the lowest life expectancy 2050-2055
Births
6
- Basic Statistic Total fertility rate worldwide 1950-2100
- Premium Statistic Crude birth rate worldwide 1990-2021
- Basic Statistic Fertility rate of the world and continents 1950-2024
- Premium Statistic Fertility rate worldwide 2000-2021, by income level
- Basic Statistic Adolescent fertility rate 2021, by region
- Premium Statistic Countries with highest adolescent birth rate worldwide 2021
Deaths
7
- Premium Statistic Countries with highest death rates 2021
- Premium Statistic Countries with lowest death rates 2021
- Premium Statistic Global adult mortality rate 1990-2021, by gender
- Basic Statistic Under-five child mortality by world region 2021
- Basic Statistic Countries with highest mortality rate among children aged under five 2021
- Basic Statistic Neonatal mortality rate worldwide 1990-2022, by region
- Basic Statistic Projected global infant mortality rate 1990-2100
Urbanization and rural areas
7
- Premium Statistic Share of urban population 2000-2050, by region
- Basic Statistic Global megacity populations 2023
- Premium Statistic Share of urban population living in slums 2020, by region
- Premium Statistic Distribution of urban areas globally 2023, by continent
- Premium Statistic Share of population worldwide living in rural areas 1990-2022
- Premium Statistic Countries with the highest rural population rates worldwide 2022
- Premium Statistic Countries with the lowest rural population rates worldwide 2022
COVID-19
7
- Basic Statistic New cases of COVID-19 worldwide from January 23, 2020 to June 13, 2023, by day
- Basic Statistic COVID-19 cases worldwide as of May 2, 2023, by country or territory
- Basic Statistic COVID-19 deaths worldwide as of May 2, 2023, by country and territory
- Basic Statistic Number of excess deaths due to COVID-19 pandemic worldwide 2021, by age and gender
- Basic Statistic Cumulative excess deaths due to COVID-19 pandemic worldwide 2020-21, by month
- Basic Statistic Cumulative excess deaths due to COVID-19 pandemic worldwide as of 2021, by region
- Basic Statistic Rate of excess deaths due to COVID-19 pandemic in select countries worldwide 2020-21
Further related statistics
10
- Deaths by motor vehicle-related injuries in the U.S. 1930-2022
- Deaths by prostate cancer in the U.S. 1950-2019
- Net earnings of UnitedHealth Group 2007-2023
- Overweight prevalence in England 2000-2021, by gender
- Medicaid long-term care services expenditures by type of service 1990-21
- New cases of mumps in the U.S. 1970-2019
- New cases of shigellosis in the U.S. 1950-2019
- Rate of new cases of tuberculosis in the U.S. 1960-2019
- New cases of Lyme disease in the U.S. 1991-2019
- Doctor visits in Germany - number per capita 1991-2021
Further Content: You might find this interesting as well
Statistics
- Deaths by motor vehicle-related injuries in the U.S. 1930-2022
- Deaths by prostate cancer in the U.S. 1950-2019
- Net earnings of UnitedHealth Group 2007-2023
- Overweight prevalence in England 2000-2021, by gender
- Medicaid long-term care services expenditures by type of service 1990-21
- New cases of mumps in the U.S. 1970-2019
- New cases of shigellosis in the U.S. 1950-2019
- Rate of new cases of tuberculosis in the U.S. 1960-2019
- New cases of Lyme disease in the U.S. 1991-2019
- Doctor visits in Germany - number per capita 1991-2021
National Geographic. (March 1, 2016). Percentage of population without access to improved water sources worldwide from 1990 to 2015 [Graph]. In Statista. Retrieved June 10, 2024, from https://internal.statista.com/statistics/519547/population-without-access-to-improved-water-sources-worldwide/
National Geographic. "Percentage of population without access to improved water sources worldwide from 1990 to 2015." Chart. March 1, 2016. Statista. Accessed June 10, 2024. https://internal.statista.com/statistics/519547/population-without-access-to-improved-water-sources-worldwide/
National Geographic. (2016). Percentage of population without access to improved water sources worldwide from 1990 to 2015. Statista. Statista Inc.. Accessed: June 10, 2024. https://internal.statista.com/statistics/519547/population-without-access-to-improved-water-sources-worldwide/
National Geographic. "Percentage of Population without Access to Improved Water Sources Worldwide from 1990 to 2015." Statista, Statista Inc., 1 Mar 2016, https://internal.statista.com/statistics/519547/population-without-access-to-improved-water-sources-worldwide/
National Geographic, Percentage of population without access to improved water sources worldwide from 1990 to 2015 Statista, https://internal.statista.com/statistics/519547/population-without-access-to-improved-water-sources-worldwide/ (last visited June 10, 2024)
Percentage of population without access to improved water sources worldwide from 1990 to 2015 [Graph], National Geographic, March 1, 2016. [Online]. Available: https://internal.statista.com/statistics/519547/population-without-access-to-improved-water-sources-worldwide/