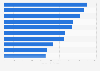
The brand value of Chennai Super Kings franchise in the Indian Premier League in 2023 amounted to about 81 million U.S. dollars. The IPL brand, as a whole, saw a growth of a staggering 134 percent since its first season 14 years ago in 2009.
Brand value of Chennai Super Kings in Indian Premier League from 2018 to 2023 (in million U.S. dollars)
Basic Account
Get to know the platform
You only have access to basic statistics.
This statistic is not included in your account.
Starter Account
The ideal entry-level account for individual users
- Instant access to 1m statistics
- Download in XLS, PDF & PNG format
- Detailed references
$199 USD / Month *
Professional Account
Full access
Business Solutions including all features.
* Prices do not include sales tax.
Other statistics that may interest you Sports sponsorship
Market overview
6
- Basic Statistic Sports sponsorship revenue worldwide 2022-2030
- Basic Statistic Sports sponsorship revenue share worldwide in 2022, by type
- Premium Statistic Sports sponsorship revenue 2022, by region
- Basic Statistic Insurance companies' sports sponsorship spending 2022
- Premium Statistic Sports sponsorship market size in the U.S. 2021-2030
- Basic Statistic Major U.S. sports leagues sponsorship revenue 2022
Sports brands
5
- Basic Statistic Value of sports empires worldwide 2024
- Basic Statistic Most valuable sports teams worldwide 2023
- Basic Statistic Most valuable soccer clubs worldwide 2023, by brand value
- Basic Statistic Brand value of selected Premier League clubs 2011-2023
- Basic Statistic World's highest paid athletes 2023/24
Sponsorship by league
6
- Basic Statistic NFL league/team sponsorship revenue 2010-2022
- Basic Statistic MLB league sponsorship revenue 2010-2023
- Basic Statistic NBA league & teams sponsorship revenue 2010-2023
- Basic Statistic Yearly value of shirt sponsor deals in the Premier League 2022-2023, by club
- Premium Statistic Yearly value of shirt sponsorship deals in the Bundesliga 2023-2024, by club
- Basic Statistic Top football club shirt sponsorship deals as of 2022/23
eSports sponsorship
5
- Basic Statistic Global revenue of the eSports market 2022, by segment
- Premium Statistic Number of eSports sponsorships worldwide 2016-2021
- Basic Statistic eSports sponsorship/advertising spending worldwide 2017-2023
- Premium Statistic eSports fans engagement with sponsors at sporting events in the U.S. 2022
- Premium Statistic eSports fans opinion on sports sponsorship in the U.S. 2022
Public opinion
6
- Premium Statistic Attitude of fans towards sports sponsorship worldwide in 2022
- Premium Statistic Soccer fans' opinion on sports sponsorship worldwide 2022
- Premium Statistic Willingness to engage with sponsors at sporting events in the U.S. 2022
- Premium Statistic Opinion on sports sponsorship in the U.S. 2022
- Premium Statistic Top types of sponsorships noticed by athletics fans in the U,S. 2022
- Basic Statistic Support for a Premier League gambling sponsor ban Great Britain 2023
Further related statistics
10
- Sponsorship spending worldwide 2007-2018
- Growth of advertising, sales promotion & sponsoring spending in N. America 2010-2018
- Spending on sponsorships worldwide by region 2009-2018
- Net sales of Dick's Sporting Goods U.S. 2006-2023
- Global net earnings of the Brunswick Corporation 2007-2023
- Foreign exchange earnings from tourism in India 2000-2022
- Number of international tourist arrivals in India 2010-2021
- International tourism receipts of India 2011-2022
- UEFA European Championship commercial revenue 1992-2021
- Per capita consumer spending in India 1974-2012
Further Content: You might find this interesting as well
Statistics
- Sponsorship spending worldwide 2007-2018
- Growth of advertising, sales promotion & sponsoring spending in N. America 2010-2018
- Spending on sponsorships worldwide by region 2009-2018
- Net sales of Dick's Sporting Goods U.S. 2006-2023
- Global net earnings of the Brunswick Corporation 2007-2023
- Foreign exchange earnings from tourism in India 2000-2022
- Number of international tourist arrivals in India 2010-2021
- International tourism receipts of India 2011-2022
- UEFA European Championship commercial revenue 1992-2021
- Per capita consumer spending in India 1974-2012
Brand Finance. (December 13, 2023). Brand value of Chennai Super Kings in Indian Premier League from 2018 to 2023 (in million U.S. dollars) [Graph]. In Statista. Retrieved June 10, 2024, from https://internal.statista.com/statistics/987324/india-brand-value-of-chennai-super-kings-franchise-in-ipl/
Brand Finance. "Brand value of Chennai Super Kings in Indian Premier League from 2018 to 2023 (in million U.S. dollars)." Chart. December 13, 2023. Statista. Accessed June 10, 2024. https://internal.statista.com/statistics/987324/india-brand-value-of-chennai-super-kings-franchise-in-ipl/
Brand Finance. (2023). Brand value of Chennai Super Kings in Indian Premier League from 2018 to 2023 (in million U.S. dollars). Statista. Statista Inc.. Accessed: June 10, 2024. https://internal.statista.com/statistics/987324/india-brand-value-of-chennai-super-kings-franchise-in-ipl/
Brand Finance. "Brand Value of Chennai Super Kings in Indian Premier League from 2018 to 2023 (in Million U.S. Dollars)." Statista, Statista Inc., 13 Dec 2023, https://internal.statista.com/statistics/987324/india-brand-value-of-chennai-super-kings-franchise-in-ipl/
Brand Finance, Brand value of Chennai Super Kings in Indian Premier League from 2018 to 2023 (in million U.S. dollars) Statista, https://internal.statista.com/statistics/987324/india-brand-value-of-chennai-super-kings-franchise-in-ipl/ (last visited June 10, 2024)
Brand value of Chennai Super Kings in Indian Premier League from 2018 to 2023 (in million U.S. dollars) [Graph], Brand Finance, December 13, 2023. [Online]. Available: https://internal.statista.com/statistics/987324/india-brand-value-of-chennai-super-kings-franchise-in-ipl/