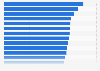
In a survey conducted in 2022 among consumers in Vietnam, about 63 percent said that social media posts had influenced their purchase of skincare and makeup products. About 62 percent of respondents made purchase decisions after being influenced by social media for clothing and accessories.
Share of consumers whose purchase decision were influenced by social media in Vietnam as of December 2022, by category
Basic Account
Get to know the platform
You only have access to basic statistics.
This statistic is not included in your account.
Starter Account
The ideal entry-level account for individual users
- Instant access to 1m statistics
- Download in XLS, PDF & PNG format
- Detailed references
$199 USD / Month *
Professional Account
Full access
Business Solutions including all features.
* Prices do not include sales tax.
Other statistics that may interest you Statistics on
About the industry
10
- Premium Statistic Main online purchase influence factors in the U.S. & UK 2022
- Premium Statistic Online shopping frequency in Russia 2022
- Premium Statistic Share of U.S. consumers influenced by social media ads 2021, by age
- Premium Statistic Online shopping planning behavior in Brazil 2021
- Premium Statistic Canadian consumers' preferred way of resolving service issues by generation 2019
- Premium Statistic Health and beauty products: purchase influences in the United Kingdom (UK) 2017
- Premium Statistic Influential channels in purchase process of shoppers in the UK 2017
- Premium Statistic Factors which drive retail store visits in the United Kingdom (UK) 2017
- Premium Statistic Cross-channel purchasing in the United Kingdom (UK) 2017
- Premium Statistic Apparel and accessories: purchase influences in the United Kingdom (UK) 2017
About the region
10
- Basic Statistic Number of users of social media advertising in Vietnam 2019-2028
- Premium Statistic Leading active social media apps among consumers Vietnam in Q3 2023, by generation
- Premium Statistic Penetration rate of leading social media apps among consumers in Vietnam Q4 2023
- Premium Statistic Leading social media apps to watch short videos Vietnam Q3 2023
- Premium Statistic Share of TikTok users among Gen Z Vietnam Q1 2020-Q3 2023
- Basic Statistic Number of users of facebook advertising in Vietnam 2019-2028
- Premium Statistic Social media users in Vietnam 2020-2029
- Premium Statistic Daily time spent using online media in Vietnam Q3 2023, by activity
- Premium Statistic Most chosen health and beauty brands in urban areas Vietnam 2022, by penetration rate
- Premium Statistic Most chosen health and beauty brands in rural areas Vietnam 2022, by penetration rate
Selected statistics
3
- Premium Statistic Where consumers shop for clothing and footwear in the United Kingdom (UK) 2013
- Premium Statistic Channels consumers use for their main grocery shop in the United Kingdom (UK) 2013
- Premium Statistic Coffee shops, tea shops and cafes: where consumers go in the United Kingdom (UK) 2013
Other regions
10
- Basic Statistic U.S. internet users paying attention to influencer recommendations 2019, by age
- Basic Statistic Italy: influences on consumer goods purchase 2019, by age group
- Premium Statistic Share of influencers expecting growth in revenue in Indonesia 2018
- Basic Statistic Most popular Canadian product categories purchased by consumers in Canada 2015
- Premium Statistic Relevance of sponsored advertising in social media in Norway 2018, by generation
- Premium Statistic Share of Instagram influencers in Russia in 2019, by number of followers
- Premium Statistic Mexico: number of influencers 2020, by followers
- Premium Statistic Latin America: countries with most influencers 2020
- Premium Statistic Chile: Instagram influencers 2020, by gender
- Premium Statistic Peru: Instagram influencers 2020, by gender
Further related statistics
9
- Social network usage for news access worldwide 2019-2023
- Sales share of L'Oréal's global cosmetic branch 2023, by business segment
- Sales share of L'Oréal's global cosmetic branch 2023, by geographic zone
- Social network profile creation in the UK 2010-2020, by socio-economic group
- Net sales growth of the leading consumer products companies worldwide 2013
- Average size of the world's leading 250 consumer products companies 2013
- Leading trends in technology in restaurants in the U.S. 2015*
- Hairdressing and beauty: Where consumers access services in the United Kingdom 2013
- Media influencing final decisions about politics in the U.S. in 2011
Further Content: You might find this interesting as well
Statistics
- Social network usage for news access worldwide 2019-2023
- Sales share of L'Oréal's global cosmetic branch 2023, by business segment
- Sales share of L'Oréal's global cosmetic branch 2023, by geographic zone
- Social network profile creation in the UK 2010-2020, by socio-economic group
- Net sales growth of the leading consumer products companies worldwide 2013
- Average size of the world's leading 250 consumer products companies 2013
- Leading trends in technology in restaurants in the U.S. 2015*
- Hairdressing and beauty: Where consumers access services in the United Kingdom 2013
- Media influencing final decisions about politics in the U.S. in 2011
McKinsey & Company. (February 23, 2023). Share of consumers whose purchase decision were influenced by social media in Vietnam as of December 2022, by category [Graph]. In Statista. Retrieved June 10, 2024, from https://internal.statista.com/statistics/1394860/vietnam-influence-of-social-media-on-consumer-purchase-by-category/
McKinsey & Company. "Share of consumers whose purchase decision were influenced by social media in Vietnam as of December 2022, by category." Chart. February 23, 2023. Statista. Accessed June 10, 2024. https://internal.statista.com/statistics/1394860/vietnam-influence-of-social-media-on-consumer-purchase-by-category/
McKinsey & Company. (2023). Share of consumers whose purchase decision were influenced by social media in Vietnam as of December 2022, by category. Statista. Statista Inc.. Accessed: June 10, 2024. https://internal.statista.com/statistics/1394860/vietnam-influence-of-social-media-on-consumer-purchase-by-category/
McKinsey & Company. "Share of Consumers Whose Purchase Decision Were Influenced by Social Media in Vietnam as of December 2022, by Category." Statista, Statista Inc., 23 Feb 2023, https://internal.statista.com/statistics/1394860/vietnam-influence-of-social-media-on-consumer-purchase-by-category/
McKinsey & Company, Share of consumers whose purchase decision were influenced by social media in Vietnam as of December 2022, by category Statista, https://internal.statista.com/statistics/1394860/vietnam-influence-of-social-media-on-consumer-purchase-by-category/ (last visited June 10, 2024)
Share of consumers whose purchase decision were influenced by social media in Vietnam as of December 2022, by category [Graph], McKinsey & Company, February 23, 2023. [Online]. Available: https://internal.statista.com/statistics/1394860/vietnam-influence-of-social-media-on-consumer-purchase-by-category/