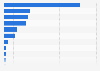
This statistic shows the distribution of road fatalities in the Republic of South Africa in 2016, by user category. The World Health Organization estimates that there were 14,507 road traffic deaths that year, which works out to be be between 25 and 26 fatalities per 100,000 population. Despite the high rates of road accidents, only a third of drivers in South Africa wear seatbelts. As a matter of fact, pedestrians are twice as likely to sustain fatal injuries from traffic accidents, making up nearly 40 percent of all road traffic-related fatalities. Riders of motorized 2- and 3-wheel vehicles represented less than one percent of all fatalities in 2016, whereas cyclist amounted to 3 percent.
Road fatalities in South Africa in 2016, by main user category
Basic Account
Get to know the platform
You only have access to basic statistics.
This statistic is not included in your account.
Starter Account
The ideal entry-level account for individual users
- Instant access to 1m statistics
- Download in XLS, PDF & PNG format
- Detailed references
$199 USD / Month *
Professional Account
Full access
Business Solutions including all features.
* Prices do not include sales tax.
Other statistics that may interest you Maruti Suzuki Limited
Passenger vehicle market
5
- Premium Statistic Share of passenger cars in total vehicle fleet India FY 1951-2020
- Basic Statistic Sales of automobiles India FY 2011-2023, by type
- Premium Statistic Passenger vehicles production volume India FY 2014-2023
- Premium Statistic Passenger vehicles sales volume India FY 2014-2023
- Premium Statistic Export volume of passenger vehicles from India FY 2015-2023
Maruti Suzuki financials
6
- Premium Statistic Maruti Suzuki net worth FY 2014-2023
- Premium Statistic Maruti Suzuki net sales FY 2014-2023
- Premium Statistic Maruti Suzuki total assets FY 2014-2023
- Premium Statistic Maruti Suzuki profit before tax FY 2016-2023
- Premium Statistic Maruti Suzuki EBIT FY 2018-2023
- Premium Statistic Maruti Suzuki earnings per share FY 2016-2023
Maruti Suzuki product sales
6
- Premium Statistic Maruti Suzuki sales volume India FY 2007-2023, by segment
- Premium Statistic Maruti Suzuki monthly sales volume of Wagon R in India 2020-2022
- Premium Statistic Maruti Suzuki monthly sales volume of Baleno India 2020-2022
- Premium Statistic Maruti Suzuki monthly sales volume of Celerio India 2020-2022
- Premium Statistic Maruti Suzuki monthly sales volume of Ertiga India 2020-2022
- Premium Statistic Maruti Suzuki monthly sales volume of Swift India 2020-2022
Competitors
7
- Premium Statistic Passenger car market share India 2023, by vendor
- Basic Statistic Car sales volume in India FY 2023, by OEM
- Basic Statistic Sales volume of Hyundai cars in India April 2024, by model
- Basic Statistic Sales volume of Tata cars in India April 2024, by model
- Basic Statistic Sales volume of Kia cars in India April 2024, by model
- Basic Statistic Sales volume of Mahindra cars in India April 2024, by model
- Basic Statistic Sales volume of Toyota cars in India 2021, by model
Further related statistics
7
- U.S. mobile wireless MOUs 2005-2021
- E-mail messaging penetration in Great Britain 2007-2020
- Smartphone adoption in the United Kingdom (UK) 2011-2018
- Types of boats used to go out on the water in the U.S. 2012
- Average annual boating days by boat type in the U.S. 2013
- Consumer concerns about cloud services in 2012
- Foreign direct investment projects in African countries between 2003 and 2012
Further Content: You might find this interesting as well
Statistics
- U.S. mobile wireless MOUs 2005-2021
- E-mail messaging penetration in Great Britain 2007-2020
- Smartphone adoption in the United Kingdom (UK) 2011-2018
- Types of boats used to go out on the water in the U.S. 2012
- Average annual boating days by boat type in the U.S. 2013
- Consumer concerns about cloud services in 2012
- Foreign direct investment projects in African countries between 2003 and 2012
WHO. (January 18, 2019). Road fatalities in South Africa in 2016, by main user category [Graph]. In Statista. Retrieved June 10, 2024, from https://internal.statista.com/statistics/1006745/road-fatalities-by-user-category-south-africa/
WHO. "Road fatalities in South Africa in 2016, by main user category." Chart. January 18, 2019. Statista. Accessed June 10, 2024. https://internal.statista.com/statistics/1006745/road-fatalities-by-user-category-south-africa/
WHO. (2019). Road fatalities in South Africa in 2016, by main user category. Statista. Statista Inc.. Accessed: June 10, 2024. https://internal.statista.com/statistics/1006745/road-fatalities-by-user-category-south-africa/
WHO. "Road Fatalities in South Africa in 2016, by Main User Category." Statista, Statista Inc., 18 Jan 2019, https://internal.statista.com/statistics/1006745/road-fatalities-by-user-category-south-africa/
WHO, Road fatalities in South Africa in 2016, by main user category Statista, https://internal.statista.com/statistics/1006745/road-fatalities-by-user-category-south-africa/ (last visited June 10, 2024)
Road fatalities in South Africa in 2016, by main user category [Graph], WHO, January 18, 2019. [Online]. Available: https://internal.statista.com/statistics/1006745/road-fatalities-by-user-category-south-africa/