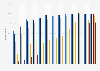
Rakuten Insight, a large majority of Indian respondents had used some form of e-payment method due to its convenience as of October 2022. Above 60 percent of respondents in the south Asian country stated that the e-payment methods were easy to use and 50 percent of respondents stated that they preferred to use e-payment services as the transactions were faster than traditional methods.
According to a survey conducted by Reasons for using e-payment methods in India in 2022
Basic Account
Get to know the platform
You only have access to basic statistics.
This statistic is not included in your account.
Starter Account
The ideal entry-level account for individual users
- Instant access to 1m statistics
- Download in XLS, PDF & PNG format
- Detailed references
$199 USD / Month *
Professional Account
Full access
Business Solutions including all features.
* Prices do not include sales tax.
Other statistics that may interest you Mobile payments in the United Kingdom (UK)
Market share
6
- Premium Statistic Most used in-store (POS) payment methods in the UK 2017-2023, with 2027 forecast
- Premium Statistic Payments at points of sale by type in the UK 2024
- Premium Statistic Biggest contactless payment brands at POS in the UK 2024
- Premium Statistic Most popular online payment methods in the UK 2022
- Premium Statistic Most popular payment methods for online purchases in the UK 2020
- Premium Statistic Biggest e-commerce payment brands in the UK 2024
Users
4
- Premium Statistic Mobile POS payment penetration rate in 34 countries worldwide 2023
- Premium Statistic Mobile payment adoption in the UK 2016-2020, by age
- Premium Statistic Mobile payments usage by situation in the UK 2024
- Premium Statistic Smartphone ownership in the United Kingdom (UK) 2012-2023, by age
Transaction volume
4
- Premium Statistic Mobile payment market size in 10 countries in Europe in 2020, with a 2025 forecast
- Premium Statistic Consumer fintech usage rate in the United Kingdom 2019, by category
- Premium Statistic FinTech Digital Payments transaction value per user in UK 2021-2028, by segment
- Premium Statistic Average carrier billing transaction value in the UK 2019-2021
Brands
5
- Premium Statistic Apple Pay penetration, online and offline, in 19 countries worldwide in Q1 2024
- Premium Statistic Google Pay penetration, online and offline, in 19 countries worldwide in Q1 2024
- Premium Statistic PayPal penetration, online and offline, in 21 countries worldwide in Q1 2024
- Premium Statistic Monthly active users of PayPal app in the UK 2017-2021
- Premium Statistic Monthly active users of the Klarna app in the UK 2018-2021
Mcommerce
4
- Premium Statistic Internet retail: monthly sales value in Great Britain 2016-2023
- Basic Statistic Internet share of retail sales monthly in Great Britain 2018-2023
- Premium Statistic M-commerce retail sales in the UK 2019-2027
- Premium Statistic PoS and e-commerce spending growth in the UK 2022, with a 2026 forecast
Further related statistics
6
- Foreign exchange earnings from tourism in India 2000-2022
- Number of international tourist arrivals in India 2010-2021
- International tourism receipts of India 2011-2022
- Per capita consumer spending in India 1974-2012
- Percentage of payments with credit card in China 2013
- Number of patients with non-communicable diseases in India 2010
Further Content: You might find this interesting as well
Statistics
- Foreign exchange earnings from tourism in India 2000-2022
- Number of international tourist arrivals in India 2010-2021
- International tourism receipts of India 2011-2022
- Per capita consumer spending in India 1974-2012
- Percentage of payments with credit card in China 2013
- Number of patients with non-communicable diseases in India 2010
Rakuten Insight. (December 29, 2022). Reasons for using e-payment methods in India in 2022 [Graph]. In Statista. Retrieved June 10, 2024, from https://internal.statista.com/statistics/1105625/india-reasons-for-using-e-payment-services/
Rakuten Insight. "Reasons for using e-payment methods in India in 2022." Chart. December 29, 2022. Statista. Accessed June 10, 2024. https://internal.statista.com/statistics/1105625/india-reasons-for-using-e-payment-services/
Rakuten Insight. (2022). Reasons for using e-payment methods in India in 2022. Statista. Statista Inc.. Accessed: June 10, 2024. https://internal.statista.com/statistics/1105625/india-reasons-for-using-e-payment-services/
Rakuten Insight. "Reasons for Using E-payment Methods in India in 2022." Statista, Statista Inc., 29 Dec 2022, https://internal.statista.com/statistics/1105625/india-reasons-for-using-e-payment-services/
Rakuten Insight, Reasons for using e-payment methods in India in 2022 Statista, https://internal.statista.com/statistics/1105625/india-reasons-for-using-e-payment-services/ (last visited June 10, 2024)
Reasons for using e-payment methods in India in 2022 [Graph], Rakuten Insight, December 29, 2022. [Online]. Available: https://internal.statista.com/statistics/1105625/india-reasons-for-using-e-payment-services/