Sales of Johnson & Johnson's top pharmaceutical products from 2021 to 2023 (in million U.S. dollars)
Basic Account
Get to know the platform
You only have access to basic statistics.
This statistic is not included in your account.
Starter Account
The ideal entry-level account for individual users
- Instant access to 1m statistics
- Download in XLS, PDF & PNG format
- Detailed references
$199 USD / Month *
Professional Account
Full access
Business Solutions including all features.
* Prices do not include sales tax.
Other statistics that may interest you Top pharmaceutical drugs
Global overview
3
Top companies' top products
5
- Premium Statistic Pfizer's top products based on revenue 2023
- Premium Statistic AbbVie's key product revenues 2022-2023
- Premium Statistic 
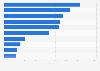
Sales of Johnson & Johnson's pharmaceutical products 2021-2023
- Premium Statistic Novartis' top drugs based on revenue 2023
- Premium Statistic Merck & Co.'s top-selling drugs 2023
Best-selling drugs
7
- Basic Statistic Top pharmaceutical products by sales worldwide 2023
- Premium Statistic Revenue of AbbVie's Humira 2011-2023
- Premium Statistic Merck & Co.'s Keytruda revenue 2014-2023
- Premium Statistic Bristol Myers Squibb's Revlimid revenues 2008-2023
- Premium Statistic Price increase of top selling drugs U.S. 2016-2021
- Basic Statistic Number of patent applications filed for top U.S. drugs 2022
- Premium Statistic Number of patents granted for the top selling U.S. drugs 2022
U.S. overview
5
- Premium Statistic Top pharma products by prescriptions U.S. 2021
- Premium Statistic Top therapy areas in the U.S. by number of prescriptions 2022
- Premium Statistic U.S. top prescribed drugs based on sales 2022
- Premium Statistic Total savings of top generic drugs in U.S. 2022
- Premium Statistic Sales at risk of pharmaceuticals due to patent expiries U.S. 2022
Outlook
5
- Basic Statistic Top therapeutic categories worldwide 2024, by number of R&D products
- Basic Statistic Projected most valuable R&D projects based on net present value 2023
- Premium Statistic Projection of top 2024 pharma and biotech launches by revenue 2028
- Premium Statistic Expiring patents for blockbuster and other small-molecule drugs worldwide 2020-2026
- Premium Statistic Sales forecast of top selling drugs worldwide 2028
Further related statistics
17
- U.S. top 10 prescribed drugs based on market share 2019
- Sales growth changes of patented drugs in Canada 2022
- Value of expiring patents in U.S. 2016-2019
- Americans' impression of the US pharma industry quality of drugs, by ethnicity 2017
- Patented drug 2022 sales share distribution by date of first NOC
- Patent drug sales impact on change in expenditure by therapy class in Canada 2017
- Rate of price change for patented drugs by country 2022
- Quantity change of patented drugs in Canada by therapy class 2015-2016
- Pharmaceutical industry: global breakdown in the sale of new drugs 2004-2022
- Definition of specialty drugs by PBMs and pharmacy executives 2011
- Patent applications for genetic drugs worldwide 2010
- Revenue market share of acne treatments sold in Spain by company 2018
- Volume of China's drug market 2007-2015
- Emission of Sinopharm 2017-2019, by exhaust gas
- Total trend for traditional therapy areas in the U.S. 2019
- Approved medicine investment projects Thailand 2018-2021
- Pharmaceutical products: manufacturers' sales in the United Kingdom 2008-2022
Further Content: You might find this interesting as well
Statistics
- U.S. top 10 prescribed drugs based on market share 2019
- Sales growth changes of patented drugs in Canada 2022
- Value of expiring patents in U.S. 2016-2019
- Americans' impression of the US pharma industry quality of drugs, by ethnicity 2017
- Patented drug 2022 sales share distribution by date of first NOC
- Patent drug sales impact on change in expenditure by therapy class in Canada 2017
- Rate of price change for patented drugs by country 2022
- Quantity change of patented drugs in Canada by therapy class 2015-2016
- Pharmaceutical industry: global breakdown in the sale of new drugs 2004-2022
- Definition of specialty drugs by PBMs and pharmacy executives 2011
- Patent applications for genetic drugs worldwide 2010
- Revenue market share of acne treatments sold in Spain by company 2018
- Volume of China's drug market 2007-2015
- Emission of Sinopharm 2017-2019, by exhaust gas
- Total trend for traditional therapy areas in the U.S. 2019
- Approved medicine investment projects Thailand 2018-2021
- Pharmaceutical products: manufacturers' sales in the United Kingdom 2008-2022
Johnson & Johnson. (February 16, 2024). Sales of Johnson & Johnson's top pharmaceutical products from 2021 to 2023 (in million U.S. dollars) [Graph]. In Statista. Retrieved June 17, 2024, from https://internal.statista.com/statistics/266405/global-revenue-of-johnson-und-johnsons-pharmaceutical-segment-by-product/
Johnson & Johnson. "Sales of Johnson & Johnson's top pharmaceutical products from 2021 to 2023 (in million U.S. dollars)." Chart. February 16, 2024. Statista. Accessed June 17, 2024. https://internal.statista.com/statistics/266405/global-revenue-of-johnson-und-johnsons-pharmaceutical-segment-by-product/
Johnson & Johnson. (2024). Sales of Johnson & Johnson's top pharmaceutical products from 2021 to 2023 (in million U.S. dollars). Statista. Statista Inc.. Accessed: June 17, 2024. https://internal.statista.com/statistics/266405/global-revenue-of-johnson-und-johnsons-pharmaceutical-segment-by-product/
Johnson & Johnson. "Sales of Johnson & Johnson's Top Pharmaceutical Products from 2021 to 2023 (in Million U.S. Dollars)." Statista, Statista Inc., 16 Feb 2024, https://internal.statista.com/statistics/266405/global-revenue-of-johnson-und-johnsons-pharmaceutical-segment-by-product/
Johnson & Johnson, Sales of Johnson & Johnson's top pharmaceutical products from 2021 to 2023 (in million U.S. dollars) Statista, https://internal.statista.com/statistics/266405/global-revenue-of-johnson-und-johnsons-pharmaceutical-segment-by-product/ (last visited June 17, 2024)
Sales of Johnson & Johnson's top pharmaceutical products from 2021 to 2023 (in million U.S. dollars) [Graph], Johnson & Johnson, February 16, 2024. [Online]. Available: https://internal.statista.com/statistics/266405/global-revenue-of-johnson-und-johnsons-pharmaceutical-segment-by-product/