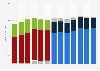
This statistic shows the average weekly household expenditure on communication in England (UK) between 2016 and 2018, by region. Households in London spent the most on average, at 19.3 British pounds this was almost 5 British pounds higher than in the North East of England.
Average weekly household expenditure on communication in England (UK) between 2016 and 2018, by region (in GBP)
Basic Account
Get to know the platform
You only have access to basic statistics.
This statistic is not included in your account.
Starter Account
The ideal entry-level account for individual users
- Instant access to 1m statistics
- Download in XLS, PDF & PNG format
- Detailed references
$199 USD / Month *
Professional Account
Full access
Business Solutions including all features.
* Prices do not include sales tax.
Other statistics that may interest you Telecoms in the U.S.
Overview
4
- Premium Statistic Global communication services revenue 2017-2028, by country
- Premium Statistic Telecommunications revenue in the U.S. 1998-2021
- Premium Statistic Service revenue of the U.S. mobile wireless industry 1985-2021
- Premium Statistic U.S. telecommunications mobile service revenue 1998-2022
Fixed
5
- Premium Statistic United States: number of fixed broadband subscriptions 2000-2022
- Premium Statistic Broadband internet subscriber numbers in the U.S. Q1 2011- Q4 2023, by provider
- Basic Statistic Countries with the fastest average fixed broadband internet speed worldwide 2024
- Premium Statistic Customer satisfaction of fiber internet service providers in the U.S. 2023
- Premium Statistic Number of fixed telephone subscriptions in the U.S. 2000-2021
Mobile
8
- Premium Statistic Mobile wireless subscriber connections in the United States 1985-2021
- Premium Statistic Number of mobile-cellular subscriptions per 100 inhabitants in the U.S. 2000-2022
- Premium Statistic Wireless carrier/operator subscriber share in the U.S. 2011-2024, by quarter
- Premium Statistic 5G and overall mobile download speed in the U.S. 2024, by provider
- Premium Statistic Wireless revenue of major mobile telecom operators/providers in the U.S. 2011-2023
- Premium Statistic Wireless service average revenue per unit in the United States 1993-2021
- Premium Statistic U.S. 5G coverage 2024, by carrier
- Premium Statistic AT&T, Verizon, and T-Mobile 5G spectrum purchases in the United States 2018-2022
Operators
6
- Premium Statistic Revenue of major telecom services companies in the United States 2008-2023
- Premium Statistic Revenue of Verizon 2012-2023, by segment
- Premium Statistic Revenue of AT&T worldwide 2006-2022
- Premium Statistic Revenue of T-Mobile US 2009-2023
- Premium Statistic DISH Network's quarterly total wireless revenue Q2 2020-Q3 2021
- Premium Statistic Telecom operators by brand value 2024
Further related statistics
10
- Japan: IT spending 2005-2014
- Employee compensation and benefits at Deutsche Bank 2006-2022
- Sales of Johnson & Johnson 2006-2023 by region
- Retail video market: consumer spending on physical video in France 2008-2022
- Number of TV households in the UK 2013-2022
- U.S. oil and gas industry CAPEX 2010-2022
- Ethical personal products: spending in the United Kingdom (UK) 2011-2021
- Prepaid debit card use in U.S. households 2013-2019, by tenure
- Consumer expenditure on video and audio equipment in the U.S. 1999-2019
- Number of TV households in the UK 2010-2019, by platform
Further Content: You might find this interesting as well
Statistics
- Japan: IT spending 2005-2014
- Employee compensation and benefits at Deutsche Bank 2006-2022
- Sales of Johnson & Johnson 2006-2023 by region
- Retail video market: consumer spending on physical video in France 2008-2022
- Number of TV households in the UK 2013-2022
- U.S. oil and gas industry CAPEX 2010-2022
- Ethical personal products: spending in the United Kingdom (UK) 2011-2021
- Prepaid debit card use in U.S. households 2013-2019, by tenure
- Consumer expenditure on video and audio equipment in the U.S. 1999-2019
- Number of TV households in the UK 2010-2019, by platform
Office for National Statistics (UK). (January 24, 2019). Average weekly household expenditure on communication in England (UK) between 2016 and 2018, by region (in GBP) [Graph]. In Statista. Retrieved June 10, 2024, from https://internal.statista.com/statistics/379989/average-weekly-communication-expenditure-england-uk-region/
Office for National Statistics (UK). "Average weekly household expenditure on communication in England (UK) between 2016 and 2018, by region (in GBP)." Chart. January 24, 2019. Statista. Accessed June 10, 2024. https://internal.statista.com/statistics/379989/average-weekly-communication-expenditure-england-uk-region/
Office for National Statistics (UK). (2019). Average weekly household expenditure on communication in England (UK) between 2016 and 2018, by region (in GBP). Statista. Statista Inc.. Accessed: June 10, 2024. https://internal.statista.com/statistics/379989/average-weekly-communication-expenditure-england-uk-region/
Office for National Statistics (UK). "Average Weekly Household Expenditure on Communication in England (Uk) between 2016 and 2018, by Region (in Gbp)." Statista, Statista Inc., 24 Jan 2019, https://internal.statista.com/statistics/379989/average-weekly-communication-expenditure-england-uk-region/
Office for National Statistics (UK), Average weekly household expenditure on communication in England (UK) between 2016 and 2018, by region (in GBP) Statista, https://internal.statista.com/statistics/379989/average-weekly-communication-expenditure-england-uk-region/ (last visited June 10, 2024)
Average weekly household expenditure on communication in England (UK) between 2016 and 2018, by region (in GBP) [Graph], Office for National Statistics (UK), January 24, 2019. [Online]. Available: https://internal.statista.com/statistics/379989/average-weekly-communication-expenditure-england-uk-region/