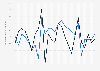
Consumer price index (CPI) of alcoholic beverages in Iceland monthly 2018-2020
This statistic shows the consumer price index (CPI) of alcoholic beverages in Iceland monthly from January 2018 to January 2020. In January 2020, the CPI of alcoholic beverages in Iceland was measured at 183.2, where the year 2008 equals 100.