In the fiscal year of 2022, the container shipping subdivision of AP Moeller-Maersk reported revenue of over 64 billion U.S. dollars. This represents an increase of 33 percent compared with the previous fiscal year as well as the highest revenue generated in the recorded period.
Maersk's ocean segment revenue in FY 2017 and FY 2022 (in million U.S dollars)
Basic Account
Get to know the platform
You only have access to basic statistics.
This statistic is not included in your account.
Starter Account
The ideal entry-level account for individual users
- Instant access to 1m statistics
- Download in XLS, PDF & PNG format
- Detailed references
$199 USD / Month *
Professional Account
Full access
Business Solutions including all features.
* Prices do not include sales tax.
Other statistics that may interest you A.P. Møller – Mærsk A/S
Overview
8
- Premium Statistic Global maritime trade carried by containers 1980-2023
- Premium Statistic Capacity of container ships in seaborne trade 1980-2023
- Basic Statistic Containerized cargo flows 2022, by trade route
- Premium Statistic Monthly container freight rate index worldwide 2023-2024
- Premium Statistic Market share of the largest container ship alliances 2012-2021
- Premium Statistic Leading container ship operators - share of world liner fleet 2024
- Premium Statistic Monthly schedule reliability of major container liners by carrier 2020-2023
- Premium Statistic EBIT margins of main container shipping companies 2014-2023
Financials
6
- Premium Statistic APM-Maersk - number of ships 2024
- Premium Statistic APM-Maersk number of TEUs 2023
- Premium Statistic AP Møller - Mærsk's revenue A/S 2009-2023
- Premium Statistic Moeller-Maersk's EBIT 2018-2022
- Premium Statistic Moeller-Maersk's year-end market capitalization 2009-2022
- Premium Statistic AP Møller - Mærsk's number of employees worldwide 2016-2022
Segments
6
- Basic Statistic AP Møller Maersk - segment revenue 2022
- Basic Statistic AP Møller Maersk - country revenue 2022
- Premium Statistic 
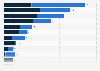
Maersk - Ocean revenue 2017-2022
- Basic Statistic A.P. Møller Maersk - cargo loaded volumes worldwide by direction 2020-2022
- Premium Statistic Moeller-Maersk's energy consumption by source 2017-2022
- Premium Statistic Moeller-Maersk's GHG emissions 2017-2022, by scope
Competitors
8
- Premium Statistic Leading container ship operators - owned and chartered ships 2024
- Premium Statistic Leading container ship operators based on total TEUs 2024
- Premium Statistic MSC - number of TEUs 2021-2023
- Premium Statistic CMA CGM: revenue 2017-2023
- Premium Statistic TEU capacity of CMA CGM Group 2021-2023
- Premium Statistic TEU capacity COSCO Group 2021-2023
- Premium Statistic Hapag-Lloyd's revenue 2018-2023
- Premium Statistic TEU capacity Hapag-Lloyd 2021-2023
Further related statistics
17
- Volume of containers handled by APM terminals 2009-2017
- APM terminals - revenue 2012-2017
- Moeller-Maersk's year-end market capitalization 2009-2022
- Maersk - invested capital by segment 2017
- COSCO SHIPPING Lines' GHG emissions per unit of logistics container 2017-2019
- COSCO SHIPPING Lines' SOx emissions 2017-2019
- COSCO SHIPPING Lines' NOx emissions 2017-2019
- CMA CGM Group's NOx emissions 2017-2019
- CMA CGM Group's SOx emissions 2017-2019
- World container ship fleet - Size
- Hanjin Shipping - number of TEUs 2016
- Scrapped vessels by type - worldwide volume 2016
- Leading container ship operators - chartered TEUs in 2022
- Shipbreaking - capacity
- Leading container ship operators - number of chartered ships 2022
- Leading container ship operators based on TEU capacity of own ships 2022
- Container shipping companies worldwide - number of ships 2022
Further Content: You might find this interesting as well
Statistics
- Volume of containers handled by APM terminals 2009-2017
- APM terminals - revenue 2012-2017
- Moeller-Maersk's year-end market capitalization 2009-2022
- Maersk - invested capital by segment 2017
- COSCO SHIPPING Lines' GHG emissions per unit of logistics container 2017-2019
- COSCO SHIPPING Lines' SOx emissions 2017-2019
- COSCO SHIPPING Lines' NOx emissions 2017-2019
- CMA CGM Group's NOx emissions 2017-2019
- CMA CGM Group's SOx emissions 2017-2019
- World container ship fleet - Size
- Hanjin Shipping - number of TEUs 2016
- Scrapped vessels by type - worldwide volume 2016
- Leading container ship operators - chartered TEUs in 2022
- Shipbreaking - capacity
- Leading container ship operators - number of chartered ships 2022
- Leading container ship operators based on TEU capacity of own ships 2022
- Container shipping companies worldwide - number of ships 2022
Maersk. (February 8, 2023). Maersk's ocean segment revenue in FY 2017 and FY 2022 (in million U.S dollars) [Graph]. In Statista. Retrieved June 10, 2024, from https://internal.statista.com/statistics/326014/revenue-of-maersk-line/
Maersk. "Maersk's ocean segment revenue in FY 2017 and FY 2022 (in million U.S dollars)." Chart. February 8, 2023. Statista. Accessed June 10, 2024. https://internal.statista.com/statistics/326014/revenue-of-maersk-line/
Maersk. (2023). Maersk's ocean segment revenue in FY 2017 and FY 2022 (in million U.S dollars). Statista. Statista Inc.. Accessed: June 10, 2024. https://internal.statista.com/statistics/326014/revenue-of-maersk-line/
Maersk. "Maersk's Ocean Segment Revenue in Fy 2017 and Fy 2022 (in Million U.S Dollars)." Statista, Statista Inc., 8 Feb 2023, https://internal.statista.com/statistics/326014/revenue-of-maersk-line/
Maersk, Maersk's ocean segment revenue in FY 2017 and FY 2022 (in million U.S dollars) Statista, https://internal.statista.com/statistics/326014/revenue-of-maersk-line/ (last visited June 10, 2024)
Maersk's ocean segment revenue in FY 2017 and FY 2022 (in million U.S dollars) [Graph], Maersk, February 8, 2023. [Online]. Available: https://internal.statista.com/statistics/326014/revenue-of-maersk-line/